What is the STRAT Method of Trading and How it can Benefit Traders
STRAT is a strategy for price action examination that primarily focuses on what the candlesticks did in the recent past and doing in the present moment to speculate next market direction.
This system was developed by Rob Smith. Its goal is to help traders achieve clarity and reduce market noise.
Let’s closely analyse the fundamentals of this chart assessment style, and share its advantages:
Key parts of STRAT trading
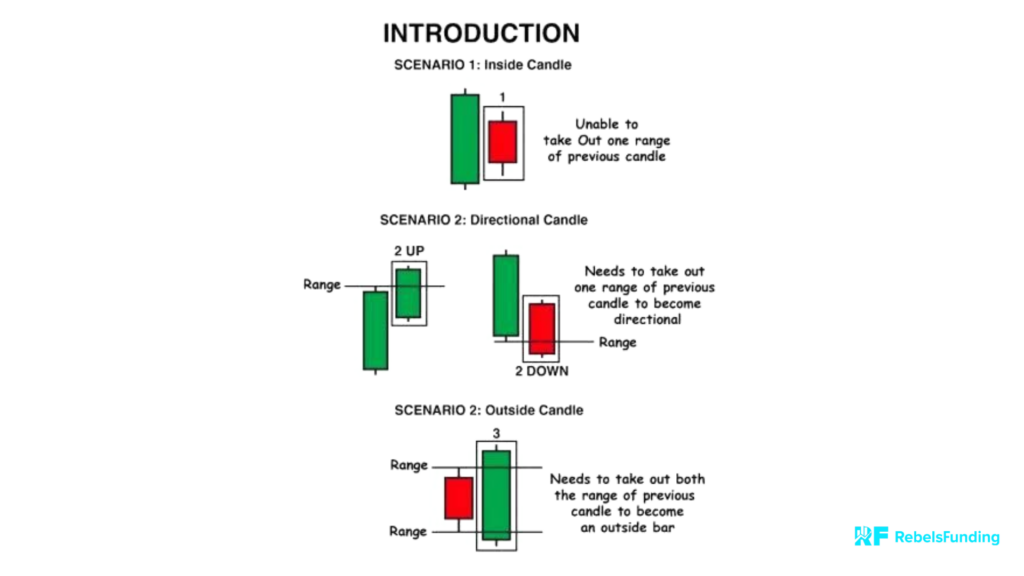
1. Candlestick patterns – The 3 Scenario
Inside bar (scenario 1): This candle is formed within the range of the previous candlestick. It implies indecision/power balance between buyers and sellers; no party is dominating — consolidation.
You should expect breakout from either of the directions.
Directional candle (2): It is a directional bar when the current candle (mostly with a big body) breaks out the previous candle high or low. It can be bullish or bearish. It usually hints momentum and price continuation in the direction of the “break”.
Outside bar candlestick (3): Here, the immediate candle takes out the high and low of the previous candle. It makes a higher high or lower low. When this happens, a trend reversal, high volatility or a continuation should be anticipated.
2. Actionable signals
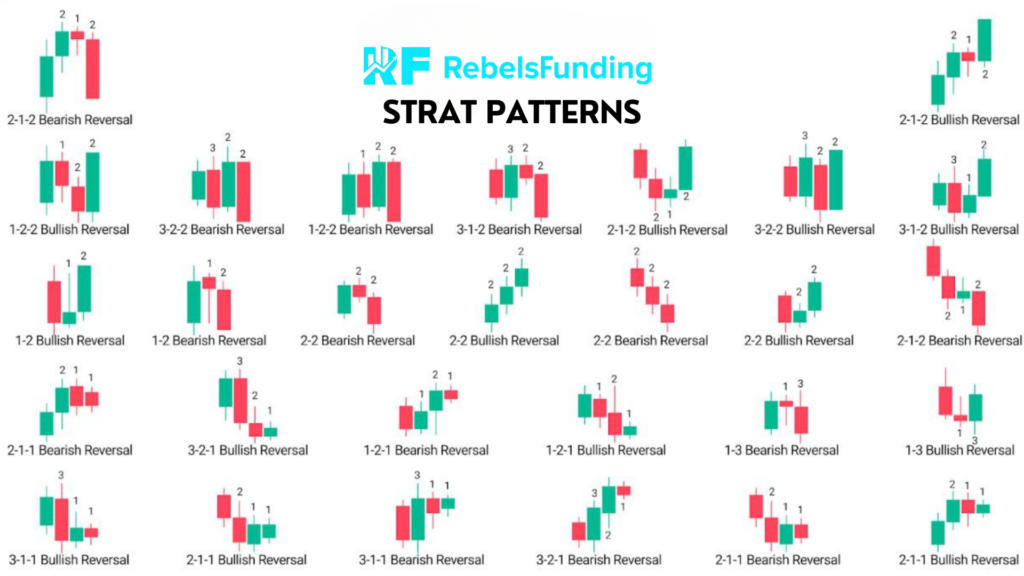
The power of this strategy also lies in its “actionable formations”. These patterns/signals are combinations of the scenarios above to discover strong trading opportunities. A few examples are seen in the image below:
3. Timeframe Continuity
STRAT emphasises multiple timeframes analysis. The position here is that when the evaluation of two higher timeframes aligns with your current timeframe, then there is a high chance of you winning your trade.
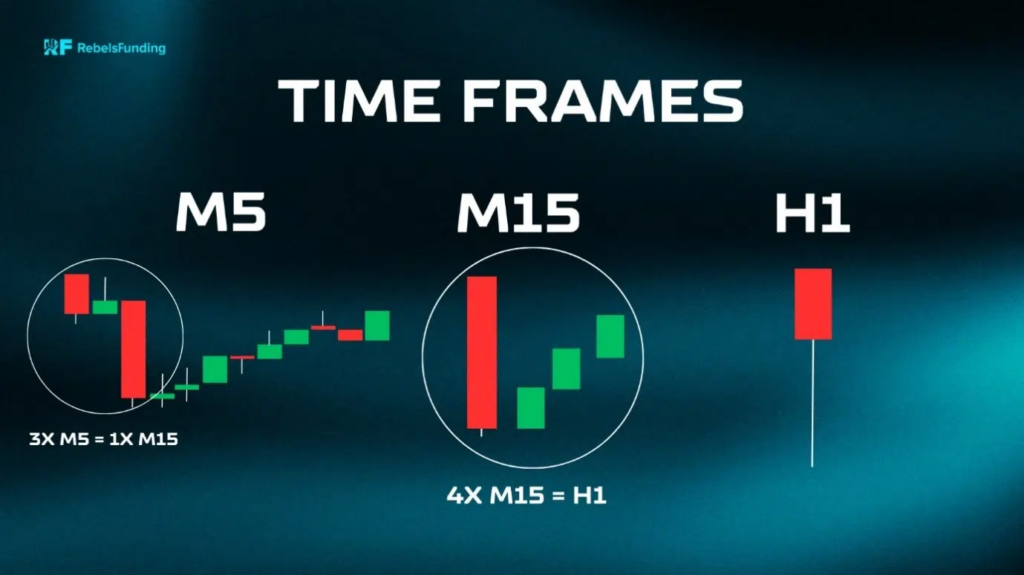
Timeframes are divided into three classes: Tides (monthly & weekly charts), waves (daily charts), and ripples (Hourly & lower time frame charts).
If you see one of the 3 scenarios or the actionable patterns “align” in all three chart groups, then that is your confirmation to key in/take action.
4. Broadening formations
The diverging trend lines show expanding volatility and lack of a clear market direction — a sign of uncertainty between market participants.

Rob Smith encourages traders to trade within the boundaries of this formation. You are advised to buy near the lower trend line and sell close to the upper one, while watching out for a breakout.
Pros
1. It gives a clear structure. Less distractions. You only have to work with price action and context.
2. Apart from forex, it can also be effective on other assets.
3. It can help you better understand how price moves; the dynamics of supply and demand.
FAQs
Can beginners use STRAT?
Yes, they can. STRAT’s structure makes it easier to find high probability setups with less indicators.
What markets can I apply the STRAT to?
You can apply it to any market with price charts.
Do I need any special tool(s) to use STRAT?
No. All you need is a trading platform that allows you to assess candlesticks across different timeframes, and to draw trend lines.
What is the most important feature in STRAT?
Time frame continuity is the heart of this methodology. When your chart timeframes agree with each other, you stand a better chance of speculating accurately.


